AMOC
Arctic Oscillation (AO)
- Phenomenon of fluctuations in the state of the atmospheric circulation over the Arctic. In its positive phase, atmospheric pressure is low in the polar region. This impacts mid-latitude wind and weather patterns by facilitating the jet stream to blow strongly and consistently from west to east, thus locking cold Arctic air in the polar region. In the negative phase of the AO, there is a high-pressure system in the polar region, which results in weaker westerly winds, and greater movement of cold polar air to the mid-latitudes.
biological productivity
- the total amount of biomass produced by living organisms (plants and animals) within a given area in a specific period of time
buoyancy forcing
- The exchange of heat and freshwater between the ocean surface and the atmosphere changes the water density at the surface and therefore the buoyancy of the water. This is called buoyancy forcing (or atmospheric forcing). Heating (cooling) results in a decrease (increase) of water density, and evaporation and sea ice formation enhance density; precipitation, runoff and ice-melt decrease density. When the density at the surface becomes higher than in the underlying water layers, the surface water sinks and mixing occurs. Buoyancy forcing an important driver of the Atlantic Meridional Overturning Circulation.
CMIP
- The Coupled Model Intercomparison Project (CMIP) is a collaborative framework which coordinates and archives multi-model climate simulations by modelling groups from around the world, to improve the knowledge of climate change and climate modelling. In this approach, simulations of multiple models with shared initial climatic conditions are compared to derive one result. Through this, uncertainties and general problems of climate models can be estimated and improved. Through averaging multiple model results, errors are mediated and climate simulations are more realistic than simulations based on single models.
convection
Convection is the spatial redistribution of particles which carry a certain amount of heat. In the ocean, convection is induced through heat losses to the atmosphere. The cooling surface water becomes heavier than the underlying water layer and sinks down, while the warmer underlying water rises. More info here
deep water formation
At the surface, the ocean exchanges heat and freshwater with the atmosphere. Cooling or an increase in salinity through evaporation or sea ice formation increase the density of the surface water and make it heavier. This leads to vertical sinking of the surface water in certain regions of the high latitudes. The newly formed deep water spreads as a deep current through the oceans. See AMOC
density
- mass per volume (kg/m3)
downscaling
- Dynamical downscaling is a method, in which coarsely resolved (see model resolution) global climate models are used in combination with high resolution regional models to simulate the future climate and to investigate regional impacts of global climate change.
East Atlantic Pattern (EA)
- Besides the North Atlantic Oscillation, the East Atlantic Pattern (EA) is a second prominent phenomenon of fluctuating air pressure differences, with an action center (high- or low-pressure area) over the eastern North Atlantic and Scandinavia, and another center over the Mediterranean Sea and North Africa. The positive phase of the EA pattern is associated with above-average surface temperatures in Europe, and with below-average temperatures over the south of the USA. It is also associated with above-average precipitation over northern Europe and Scandinavia, and with below-average precipitation across southern Europe.
eddy-resolving
- Model with a spatial resolution smaller than 1/10°
ensemble model simulation
- In ensemble model simulations, one model is run multiple times with slightly varying initial conditions (such as small temperature differences), and the results are averaged. In modelling, small changes of the initial conditions can lead to big impacts in the simulations. Therefore, the average of multiple model runs is often more realistic than the result of a single model run.
hindcast / retrospective forecast
- A hindcast is a model simulation of a past event which can be compared to observational data. In this way, hindcasting is a method to test how realistic the model output is compared to the known result.
index, pl. indices
- a numerical measure or indicator for how a situation is changing
IPCC
- The Intergovernmental Panel on Climate Change (IPCC) is an international governmental organization of the United Nations, with the aim to provide the world with an objective, scientific view of climate change, its natural, political and economic impacts and risks, and possible response options.
linear inverse Model
- A linear inverse model starts with the effects and then calculates the causes. It is the inverse of direct or forward modelling, which starts with the causes and then calculates the effects.
mixed layer
- The mixed layer is the uppermost layer of the ocean. It constitutes the oceans connection to the atmosphere through the exchange of fresh water, heat, and gases. These interactions with the atmosphere modify the temperature and salinity and hence the buoyancy of the surface water, which can lead to vertical mixing with the underlying water. The depths of this vertical mixing is the mixed layer depth, it determines the characteristic feature of the mixed layer of thoroughly mixed properties, and hence its name.
mixing
- Mixing processes transport heat, salt and other dissolved substances between water layers of different densities. More info here
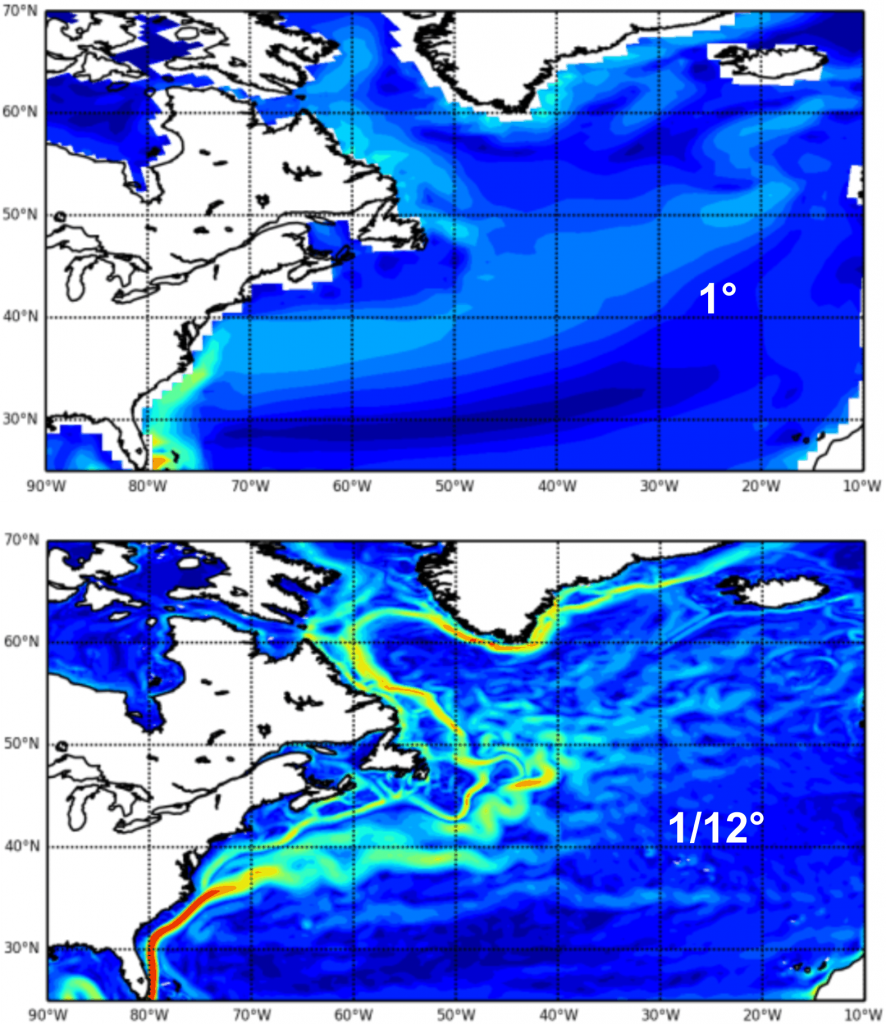
model resolution
- An ocean model is a mathematical representation of the real ocean, the behavior of the ocean is described by equations that are solved at points on a three-dimensional grid in the ocean. The spatial resolution specifies how large (in degrees of latitude and longitude or in km) the grid cells in a model are. Higher resolution models provide much more detailed information and therefore more realistic simulations, but take lots more computing time. In order to resolve small structures such as eddies (swirling coherent vortices that are omnipresent in the ocean), models need a resolution of less than 1/10°.
North Atlantic Oscillation (NAO)
- Weather phenomenon of fluctuations in the difference of atmospheric pressure at sea level between the Icelandic Low and the Azores High. The fluctuations in strength of this low-high pressure system control the direction of westerly winds and location of storm tracks across the North Atlantic, and therefore influence temperatures and precipitation in Europe. A large difference in the air pressure at the two stations (denoted NAO+) leads to increased westerly winds over the Atlantic bringing moist air to Europe, and consequently cool summers and mild and wet winters. In contrast, if the air pressure difference is low (NAO-), westerlies are suppressed, leading to more extreme temperatures with heat waves in summer, and cold dry winters in Northern Europe, and storms track southwards toward the Mediterranean Sea. This brings increased storm activity and rainfall to southern Europe and North Africa.
reanalysis
- Ocean reanalysis is a method of combining historical ocean observations with a general ocean model driven by historical estimates of surface winds, heat, and freshwater by data assimilation methods, to reconstruct historical changes in the state of the ocean. Over time, models are further developed, and to be consistent, already available model analyses of the past years to decades are reanalyzed with a modern model based on all available observational data. As historical ocean observations are sparse, ocean reanalyses have the potential to extend observation-based ocean estimations, as well as to provide more accurate information than model-only based estimates.
regionalization
- Due to computational feasibility, global climate models have relatively coarse resolution. This can result in significant errors. Regionalization is a method, in which coarsely resolved global climate models are used in combination with high resolution regional models to simulate the future climate and to investigate regional impacts of global climate change.
Representative Concentration Pathways (RCPs)
- Model scenarios that include emissions and concentrations of greenhouse gases, aerosols and chemically active gases, as well as land use/land cover. Four different RCPs were used for the fifth assessment report of the IPCC, they correspond to the following global warming and sea level rise projections:
| Szenario | 2046 – 2065 | 2081 – 2100 |
| RCP2.6 | 1.0 (0.4 – 1.6) | 1.0 (0.3 – 1.7) |
| RCP4.5 | 1.4 (0.9 – 2.0) | 1.8 (1.1 – 2.6) |
| RCP6.0 | 1.3 (0.8 – 1.8) | 2.2 (1.4 – 3.1) |
| RCP8.5 | 2.0 (1.4 – 2.6) | 3.7 (2.6 – 4.8) |
| Szenario | 2046 – 2065 | 2081 – 2100 |
| RCP2.6 | 0.24 (0.17 – 0.32) | 0.40 (0.26 – 0.55) |
| RCP4.5 | 0.26 (0.19 – 0.33) | 0.47 (0.32 – 0.63) |
| RCP6.0 | 0.25 (0.18 – 0.32) | 0.48 (0.33 – 0.63) |
| RCP8.5 | 0.30 (0.22 – 0.38) | 0.63 (0.45 – 0.82) |
Scandinavian Pattern (SCA)
- Air pressure pattern consisting of a primary circulation center (high- or low-pressure area) over Scandinavia, with weaker centers of opposite sign over the northeastern Atlantic and over central Siberia to the southwest of Lake Baikal. The positive phase of the Scandinavia pattern is associated with below-average temperatures across central Russia and also over western Europe in winter. It is also associated with above-average precipitation across central and southern Europe, and below-average precipitation across Scandinavia.
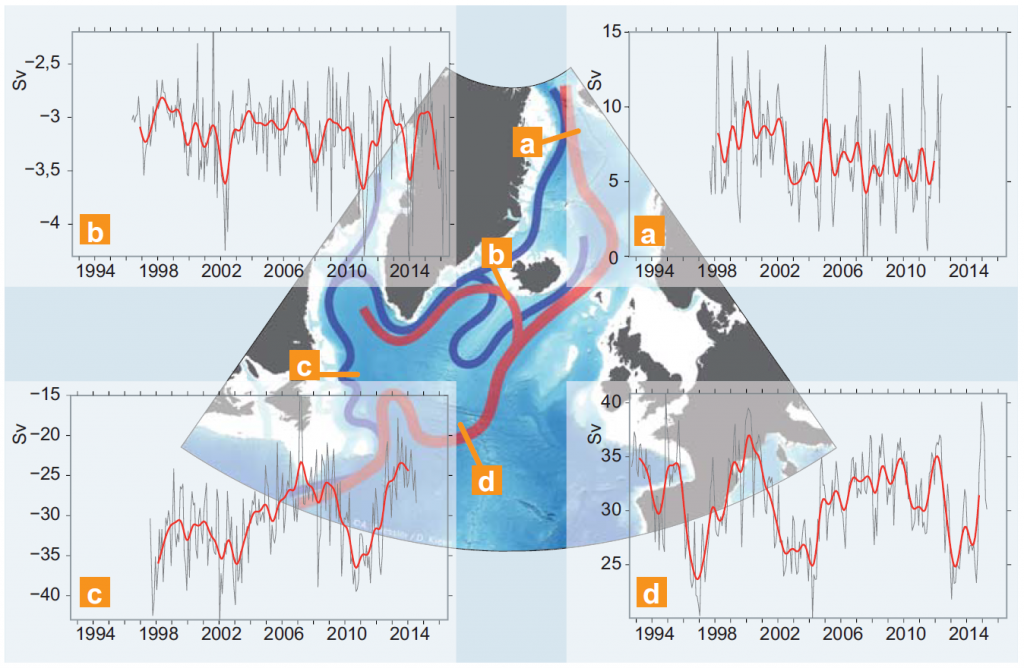
Sverdrup (Sv)
- The unit commonly used in oceanography for the water volume that is transported by a current is Sverdrup (Sv), named after the Norwegian oceanographer Harald Sverdrup. 1Sv = 1Mio. m3/s
thermohaline circulation
- A part of the large-scale ocean circulation that is driven by changes in temperature (thermo) and salinity (haline) at the ocean surface through the exchange of fresh water and heat with the atmosphere. Cooling or an increase in salinity increase the density of the surface water and make it heavier, which leads to sinking of the surface water in the high latitudes (deep water formation). This deep water then spreads as deep currents through the oceans. See AMOC.
time series
- Series of data points in time order. Typical examples of ocean data displayed in time series are temperature, salinity, current velocity, and transports.
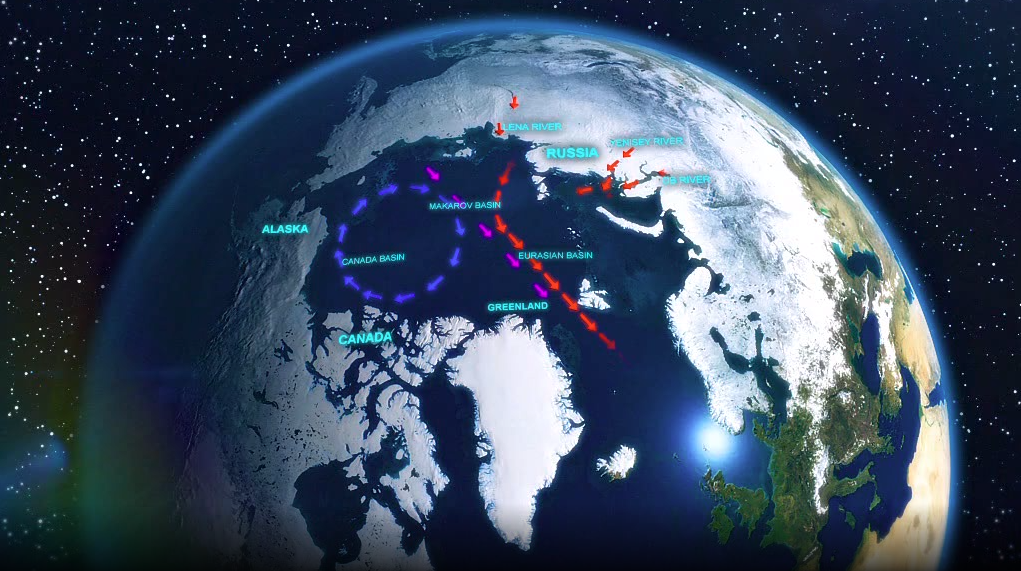
Transpolar Drift
The Transpolar Drift is a major wind driven ocean current in the Arctic Ocean, transporting sea ice and freshwater runoff from the northern coast of Russia and Alaska toward the Atlantic Ocean.
transport
- The strength of an ocean current is measured by the water volume transported by that current. The transport is commonly measured in Sverdrup (Sv), named after the Norwegian oceanographer Harald Sverdrup. 1Sv = 1Mio. m3/s.
water mass
- Identifiable body of water with properties (such as temperature, salinity, oxygen content) distinct from the surrounding water, which reflects a common formation history. Water mass formation happens at the sea surface in contact with the atmosphere; there, gas exchange occurs and heat and freshwater fluxes modify the density of the surface water and induce sinking, imprinting on the newly formed water mass the depth level at which it will spread throughout the ocean. Ocean researchers investigate how water masses move, get distributed and mix throughout the oceans. Water masses are distinguished by their formation region, such as the Labrador Sea Water, and also by their vertical position in the ocean, such as North Atlantic Deep Water or Antarctic Bottom Water.
western boundary currents
- Strong, persistent currents along the western coastlines of the world’s major ocean basins. A prominent example is the Gulf Stream in the Atlantic Ocean.