In seafaring, humans utilized ocean currents to their benefits already centuries ago. First maps and measurements of the Gulf Stream date back to the American scientist Benjamin Franklin. In 1769, Franklin solved the problem of the postal services to the American colonies, that mail ships from Europe to North America took several weeks longer to reach their destination than ships on the opposite route. He discussed the issue with his cousin Timothy Folger, who was a ship captain in the whaling industry and had a lot of experience with this particular ocean current. Together, Franklin and Folger drew the first nautical chart of the Gulf Stream and delivered it to British mail ships.
During 1775 and 1776, Franklin took temperature measurements across the Gulf Stream to aid navigation. He discovered one of the most characteristic features of the Gulf Stream, the difference in temperature compared to the surrounding water. “I find that it is always warmer than the sea on each side of it,” he wrote in a letter. At that time, estimates of current velocity were determined from the rate of separation of ships within the current and ships on the outside of it.
Nowadays, modern technologies provide diverse opportunities to observe the ocean currents. Ship based measurements still play a major role, but some study areas have limits in terms of accessibility depending on the season, such as the Arctic and the Antarctic during winter. Ship measurements are complemented by moored sensors that provide continuous measurements, autonomous floats, satellite measurements, and sensors that are carried by marine mammals.
Check out how RACE projects observe the Atlantic Ocean: WP1.1, WP1.2, WP1.3, WP2.1, WP2.2
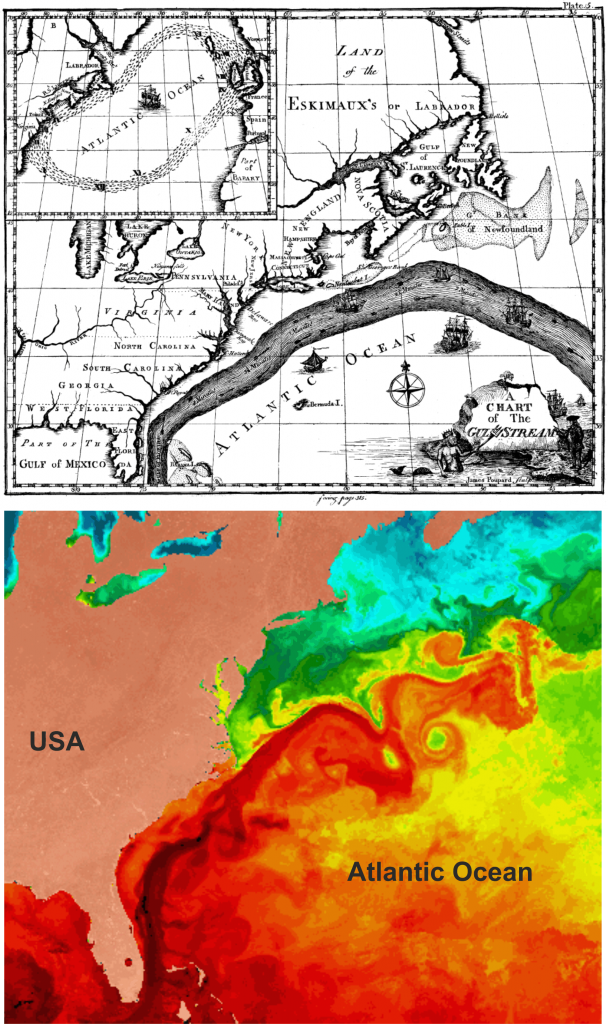
Bottom: Satellite image of sea surface temperatures, the Gulf Stream stands out against the surrounding water through higher temperatures in shades of red and orange (Image credit: Otis Brown, RSMAS – University of Miami).
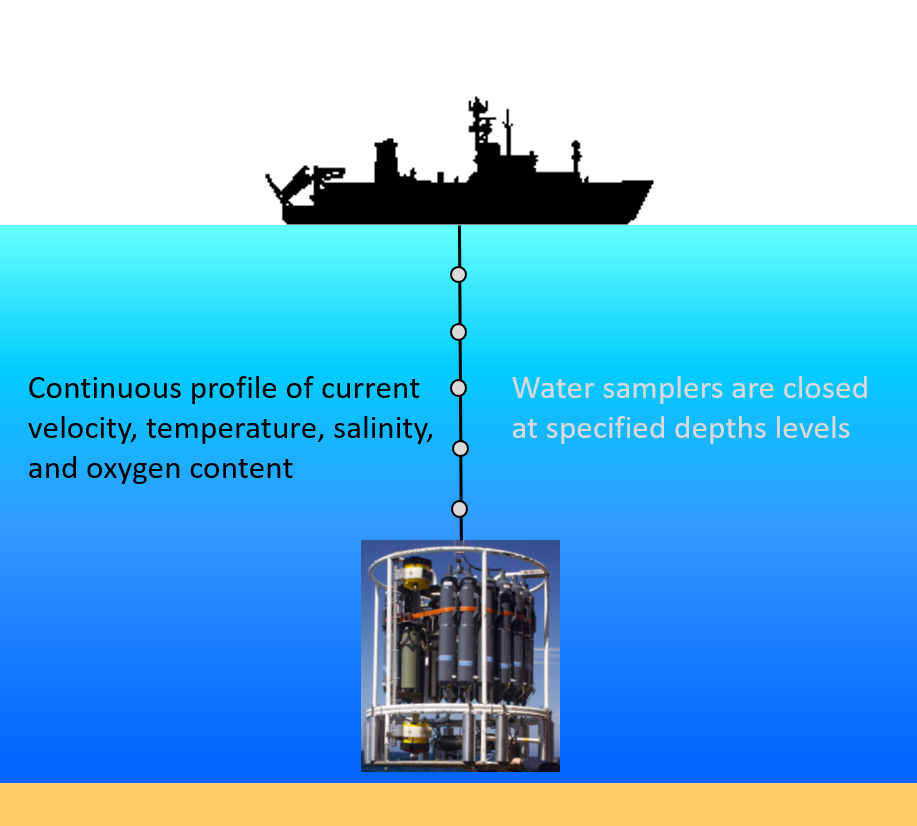
Ship-based measurements
During a research cruise, measurements of the ocean currents are conducted on selected cross-sections. The acquired data are current velocity, and water properties such as temperature, salinity, oxygen content as well as other gases and nutrients. On specified locations of the cross-section, the ship stops and measuring instruments and water samplers attached to a frame are lowered from the surface to the seafloor to measure a profile of the entire water column. The water samplers are closed at desired depths levels, and back on deck water samples are taken. Profiles are usually spaced within a few kilometers distance of each other, and cross-sections are repeated once to a few times per year. Through these measurements, a large-scale picture of the ocean currents can be attained (more info here).
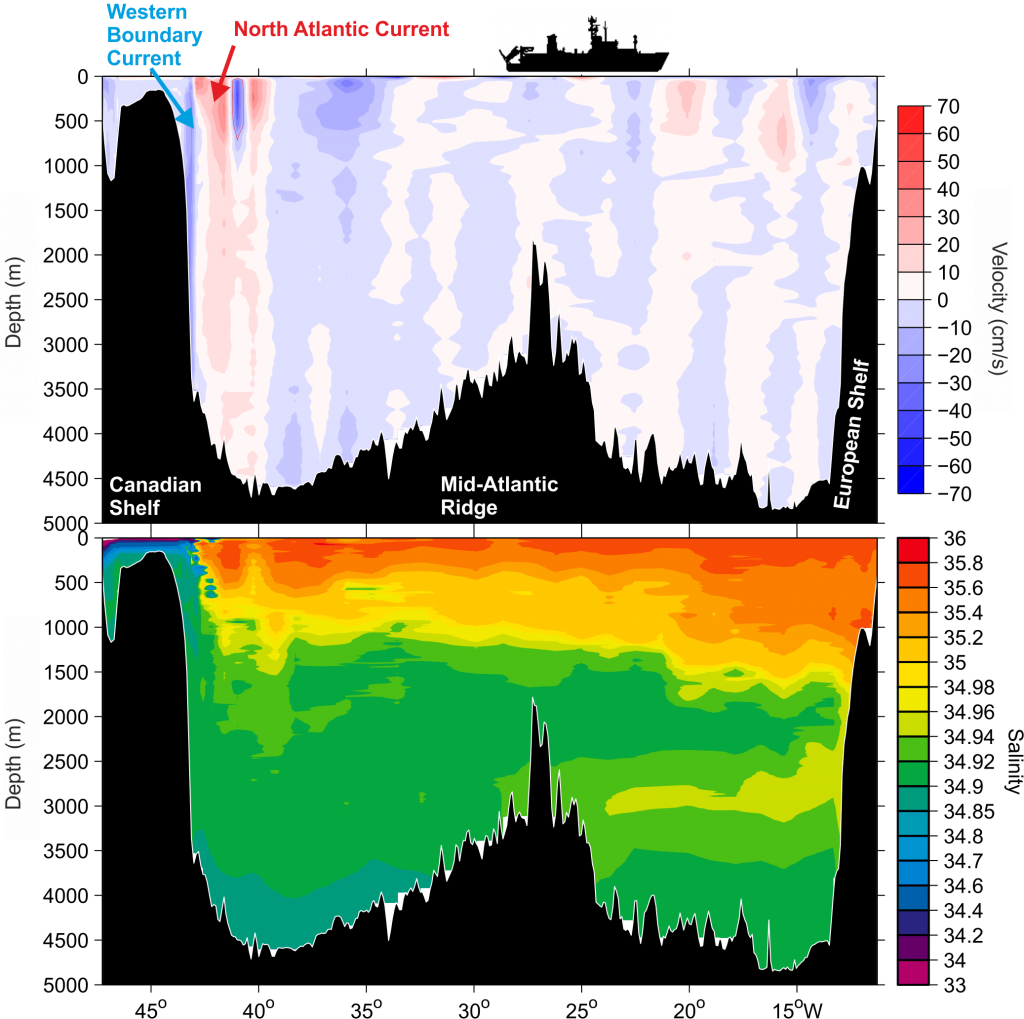
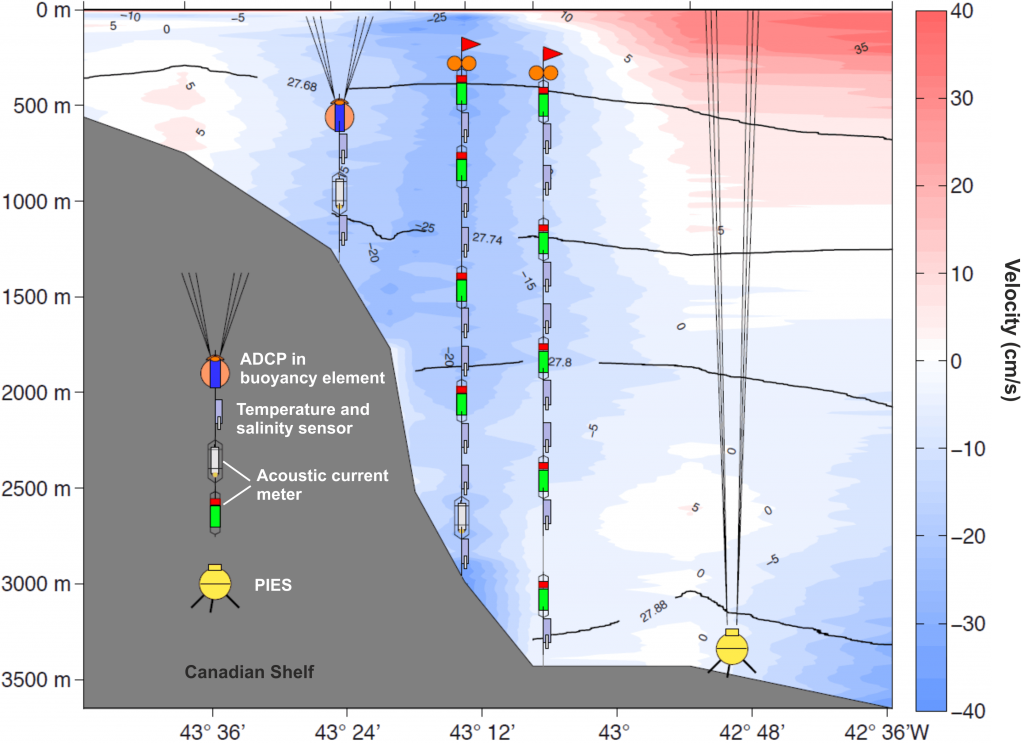
Bottom: Salinity measurements in the Atlantic Ocean. Near-surface waters at the Canadian Shelf are of polar origin and have therefore lower salinities than the salty North Atlantic Current carrying water from the subtropics. (Image: IUP, University of Bremen)
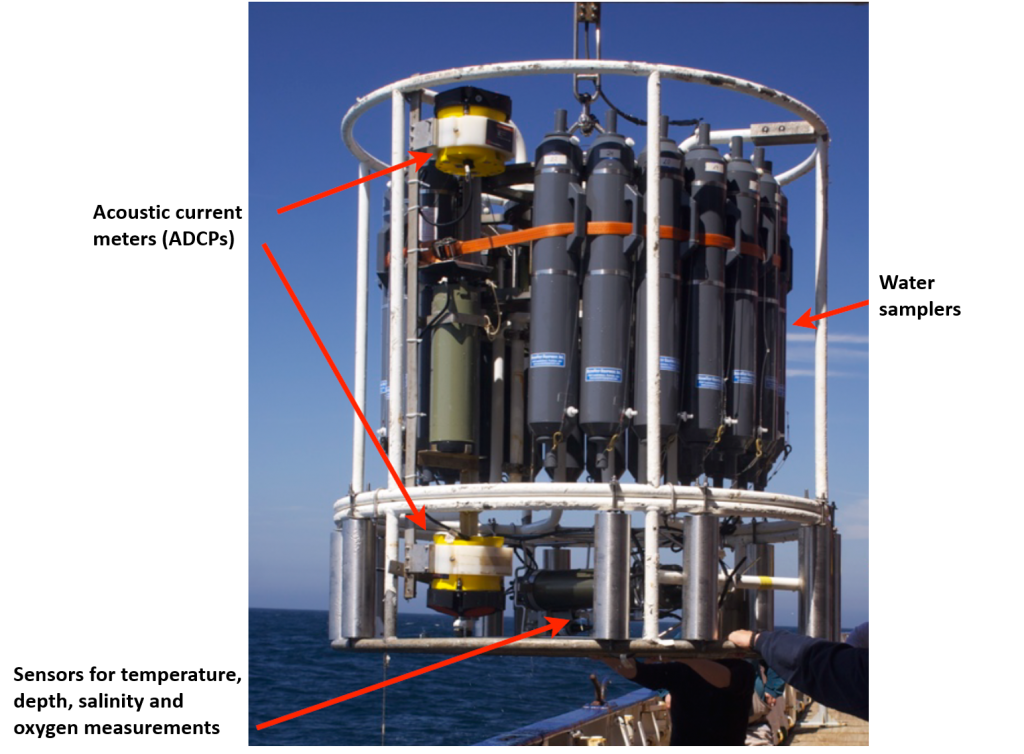
Current velocities are measured with current meters, one type is the so-called Acoustic Doppler Current Profiler (ADCP). These instruments measure velocities through the Doppler Effect: if an acoustic source moves relative to an observer, the frequency of sound experienced by the observer changes. If the source moves toward the observer, the sound is more high-pitched, if it moves away the sound is more low-pitched. An ADCP emits an acoustic signal that is reflected on small particles such as plankton drifting passively with the currents. The reflected sound signal is subject to a Doppler frequency shift due to the motion of the particles. This frequency shift is detected by the ADCP and used to calculate the velocity of the current that carries the passive floaters. Some research vessels have permanently mounted ADCPs in the ship’s hull, which continuously record velocity data in the upper 1000m of the water column.
Moorings
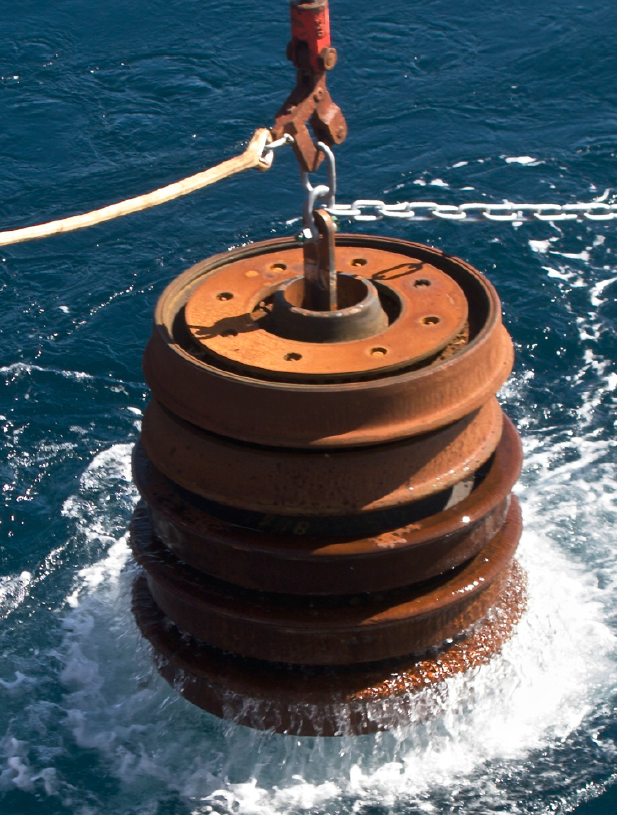
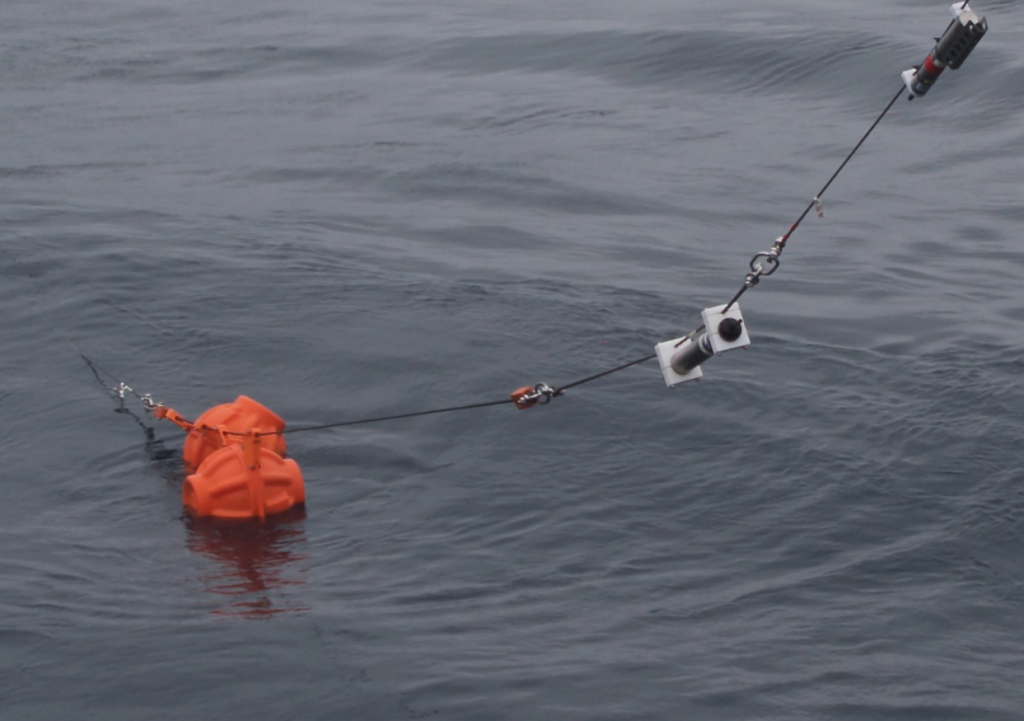
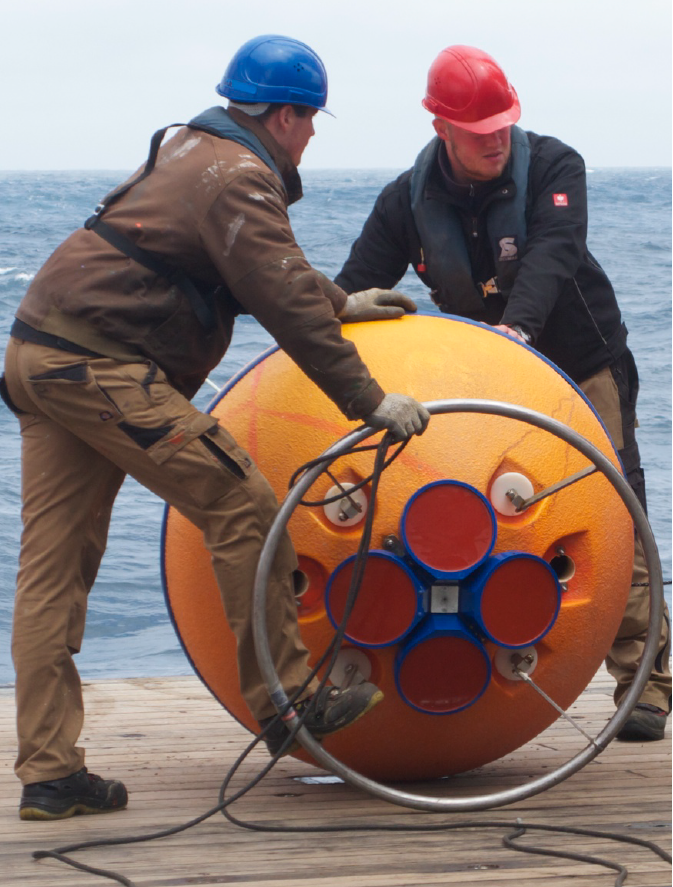
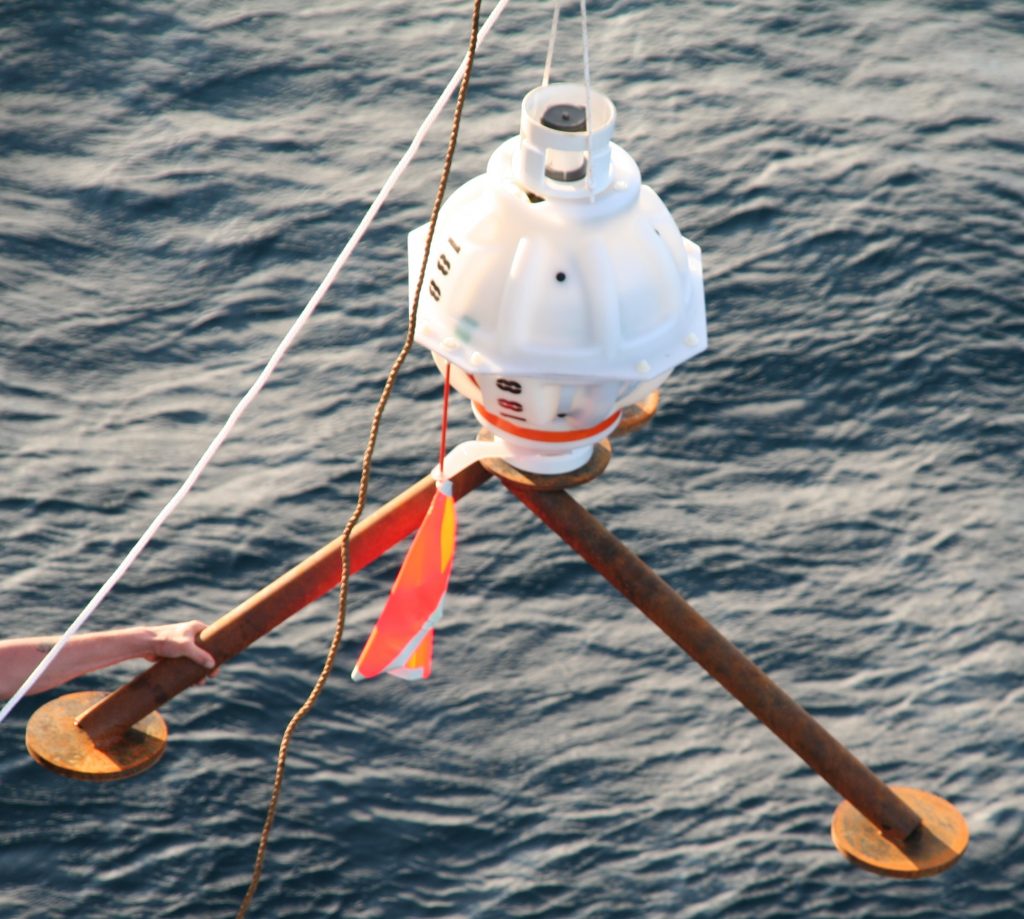
To measure currents continuously over long periods of time, moorings in key areas of the ocean are necessary. Typical measuring instruments attached to moorings are temperature and salinity sensors and current meters. These instruments are attached at a rope which is held with an anchor at the seafloor. The mooring is held upright in the water column by buoyancy elements, which ensure that data is acquired at specific depths levels, and that all instruments can float back to the surface once the mooring is recovered. To recover a mooring, an acoustic signal is emitted via a hydrophone from the ship, which activates a releaser in the mooring to free the rope directly above the anchor. As soon as the instruments are sighted and collected from the ocean surface, the recorded data is retrieved and the mooring equipment is checked and prepared for the next deployment. Moorings are typically recovered once a year to retrieve the data. In order to withstand the extreme environmental conditions of the deep ocean with corrosive salt water, enormous pressures as well as currents, all mooring components must be particularly durable. Moorings make it possible to detect fluctuations in ocean currents and water properties on time scales of minutes to years.
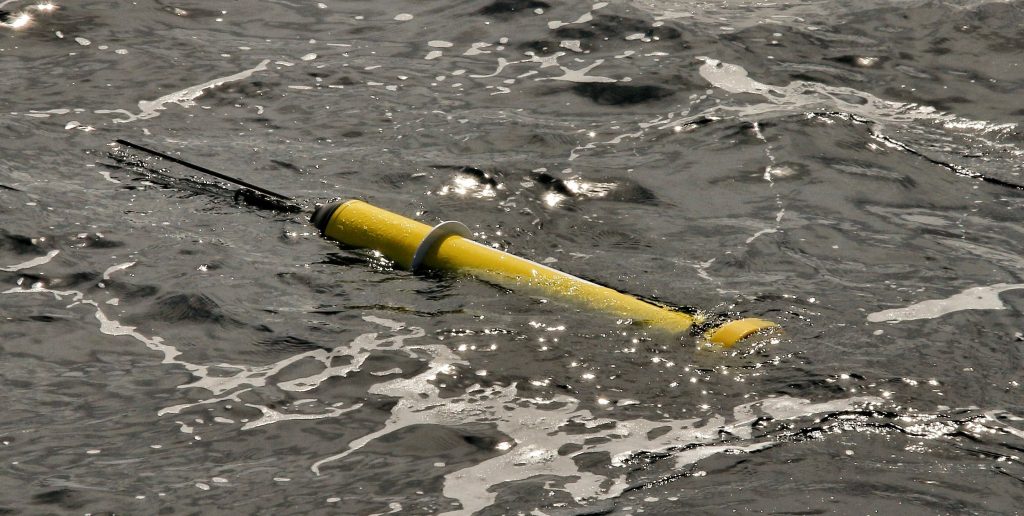
Another instrument moored on the seafloor is a Pressure Inverted Echo Sounder (PIES). A PIES acoustically measures the distance to the sea surface, the data is used to estimate the large scale mass transports of the ocean currents (more info here).
Argo Floats
Autonomous Argo Floats were derived from the stationary mooring sensors. Equipped with sensors and a hydraulic swim bladder, floats can to sink down to a depth of 2000m and rise up to the ocean surface again, meanwhile measuring a temperature and salinity profile. At the surface, the float position is detected, and the recorded data is transmitted to a satellite. After the data transmission, the float drifts for 10 days with the currents in a depth of 1000m before it starts a new measuring cycle. The mobility of the floats allows to acquire data of entire ocean areas.
The Argo Float program is a global observing system of the upper 2000m of ice-free ocean regions, and currently comprises more than 3800 free-drifting profiling floats. The project is a multi-national collaboration of 34 countries, which deploy and monitor floats and analyze the data. Once deployed, the battery-powered floats conduct measurements for approximately four years. New missions of the Argo Float program are floats that can dive and measure profiles down to a depth of 6000m, as well as floats equipped with additional sensors to measure oxygen, nitrate and chlorophyll, and water pH.
Floats differ from gliders and Autonomous Underwater Vehicles (AUVs) by drifting passively with the ocean currents, while gliders and AUVs independently drive through the oceans (more info here).
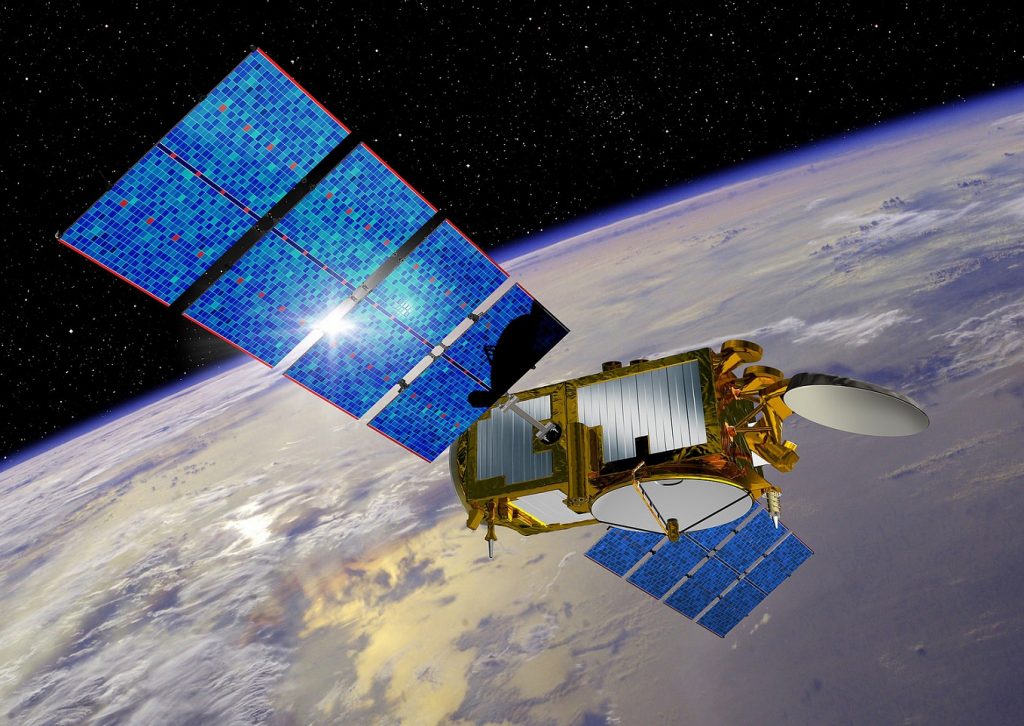
Satellite measurements
Remote sensing with satellites allows to survey large parts of the world oceans in a short amount of time. Satellites are used to observe the global ocean circulation, to investigate ocean-atmosphere interactions, to detect events like El Niño, and to get insights about sea level rise and climate change. Satellite measurements are restricted to the ocean surface however, the interior ocean remains largely hidden from a satellite’s view. Satellite measurements provide sea surface temperature and sea surface salinity data, sea surface height, surface current velocities, ice coverage, and ocean color used to estimate chlorophyll content and phytoplankton distributions, which form the foundation of oceanic food chains.